National Geographic

Data Visualisation & Storytelling

Rapid prototyping

UX / UI Design

Information Design

Interactive Data Visualisation

Full Stack Development

Data Stories & Microsites

Webby Awards

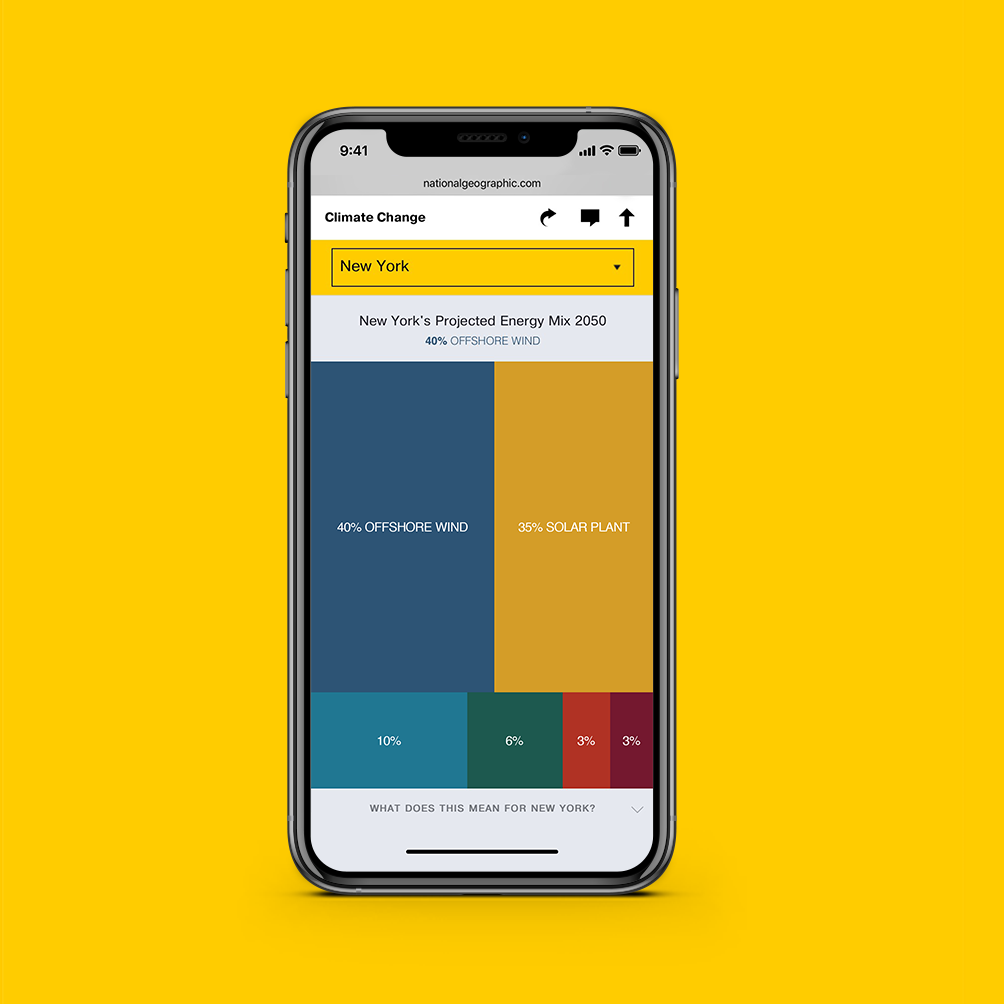
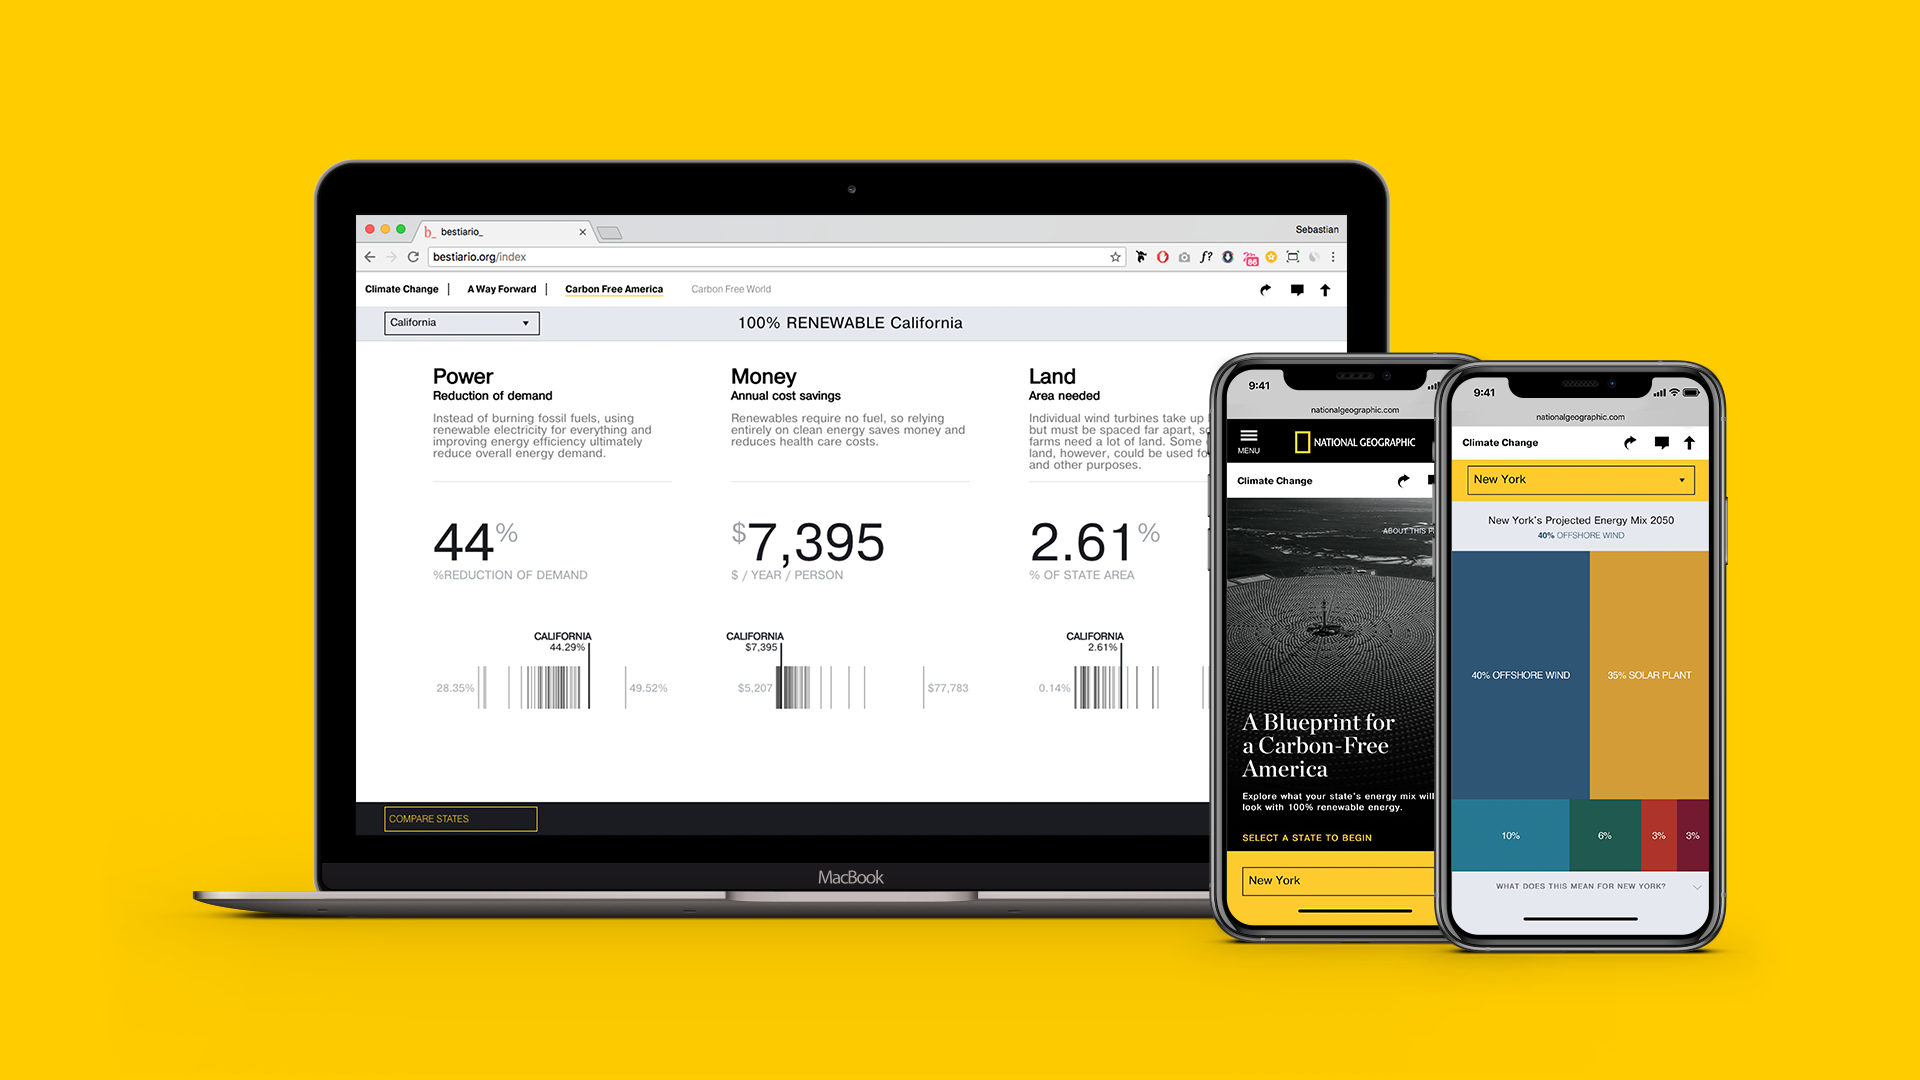
“In the span of just a few decades, the United States could eliminate fossil fuels and rely 100 percent on renewable energy.” That is the bold vision of Stanford engineering professor Mark Jacobson, who produced a state-by-state road map of how the country could wean itself off coal, oil, natural gas and nuclear power.

Carbon-free Future America

Making Energy Transition Understandable for All

National Geographic needed a compelling story, a visual narrative to communicate the story behind a dataset obtained from an academic study commissioned by Stanford University which set out how the United States could transition away from fossil fuels. National Geographic wanted to explore approaches to educate and empower their readers around this complex issue. Our challenge at Bestiario was to take all of this data and transform it into an engaging and insightful tool for readers to educate themselves.

Challenge

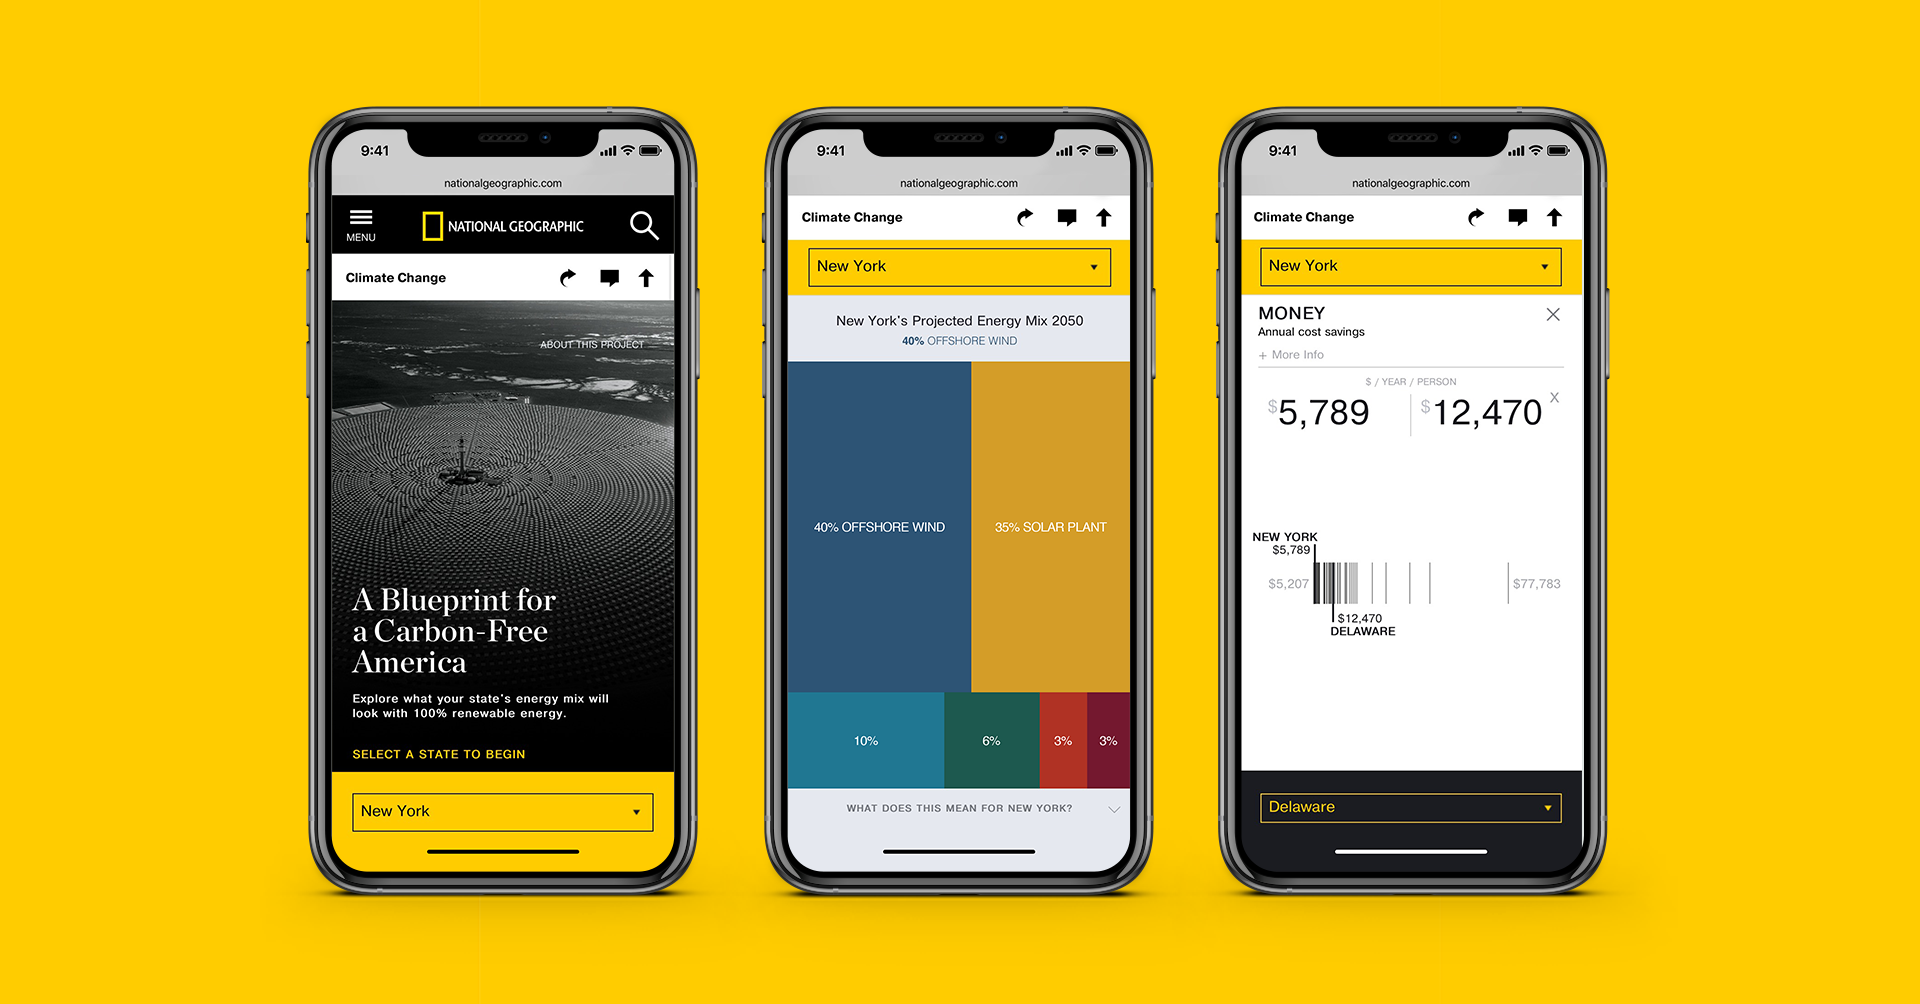
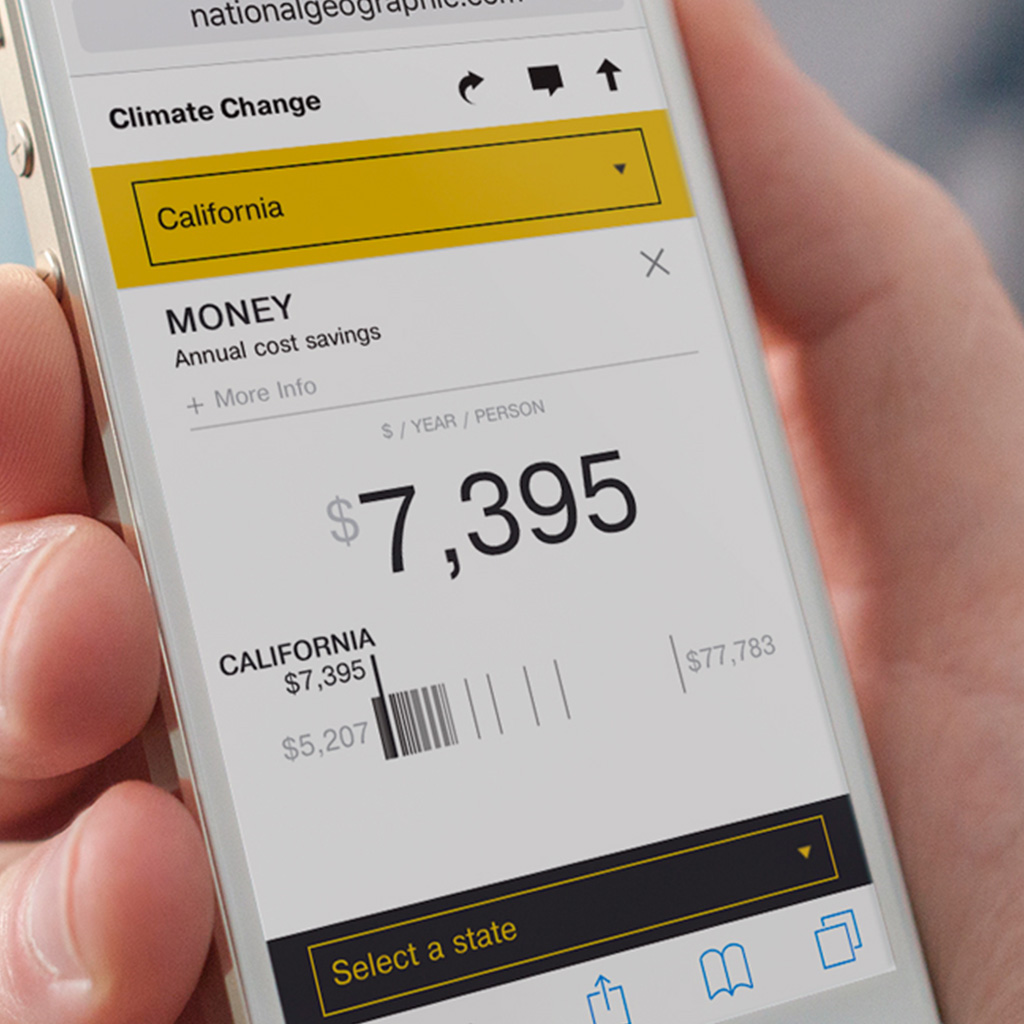
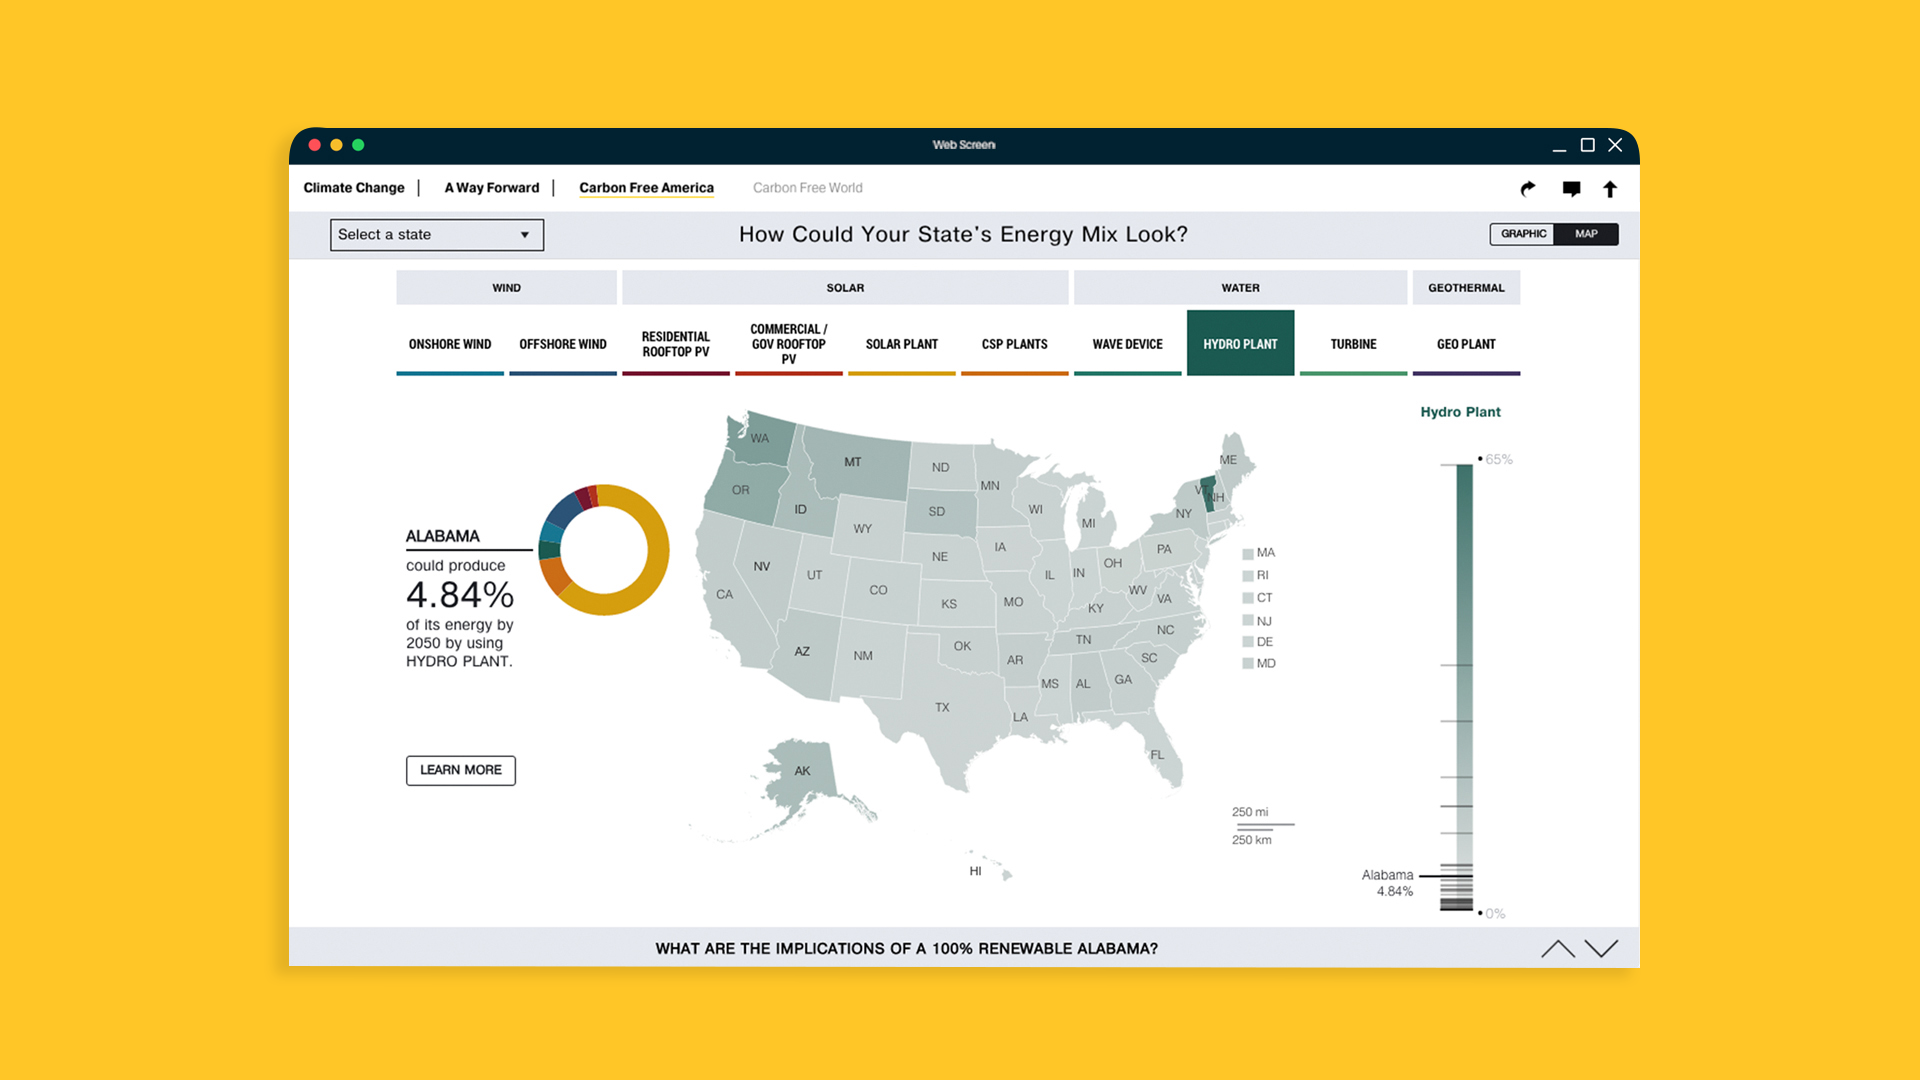
Bestiario designed an educational, user-friendly interactive resource that presented key sustainable energy data in a visually engaging and informative format. Readers now had a new tool that equipped them with a better understanding of the sustainable energy transition but crucially, allowing them to engage with the content on their own terms as the reader is in control of their learning experience.

Solution

Our integrated TreeMap and National Overview Map deliver an immersive exploration of the U.S. renewable energy outlook for 2050, allowing users to analyze state-specific energy mixes and performance via interactive charts, maps, and rankings across key sources like wind, solar, and geothermal. State Insights further enrich understanding with data on power reduction, cost savings, and land use, emphasizing the transition to a carbon-free future.​